19 KiB
Seminar System Immunology
Experimental techniques to acquire high‐throughput quantitative data
Author
Christoph Schwörer
Betreuer
Sven Nahnsen
13.11.2008
1. Introduction
In the past few years System Biology has emerged from the field of computational biology. The processing power of new computers and the development of new techniques led to new approaches in the understanding the complete picture of what happens inside a single cell or an entire organism. Instead of looking at one particular reaction, interaction of between single proteins or even a whole pathway we now want to look at the status of a whole cell at once. Thus we can come to understand the interaction of whole Pathways or the complete cellular reaction to a certain stimulus.
But to build these new models we need reliable statistics. In order to get to these reliable statistics we need many sets of data from different sources. One of the reasons is why there have been several new techniques developed to acquire data in huge amounts. Which is why they are called high throughput methods. Because they process whole experiments at once, like screening the genome for a certain sequence. This report will now give an introduction to the basic techniques used to prepare these high throughput methods as well as an introduction to the most important high throughput methods.
2. Basic techniques
In order to conduct high throughput experiments we have to prepare them carefully. This means we have to separate cells from one and another if we want to test only certain cells with specific properties. Or we have to separate certain compartments within a cell if we want to test them alone. On the other hand we have to provide certain cells with these wanted properties in order to do comparison tests. In this chapter we will now discuss the basic techniques used to prepare high throughput experiments.
2.1 Restriction Enzymes / Gel Electrophoresis
Gel electrophoresis can be used for two different purposes. On the one hand it can be used to identify the relationship between different cell lines on the other it can be used to break down the isolate short strands of DNA for further use.
The first step in this procedure is to break down the very large strands of cellular DNA into short fragments. This is accomplished by restriction enzymes. enzymes Restriction recognize short sequences of double stranded DNA, which are typically about 10 to 12 basepairs long, and these specific cut sequences. There exist about several hundred different restriction enzymes which all have different recognition sites.
Figure 1: Agarose Gel with luminescent DNA strands
the DNA at
After the DNA is completely digested by a restriction enzyme the solution is put on an agarose gel. The gel is then applied with an electrical field so DNA strands are pulled to the electrodes. In dependency of their length and charge the different DNA strands will travel at different speed so that after a given time they separate and reach different points in the gel. With the addition of luminescent chemicals the strands can be made visible so that they form a pattern of strands on the agarose gel (see figure 1)
2.2 1D/2D Protein Gels
Gel electrophoresis can not only be used to separate DNA strands but it can also be used to separate proteins. The problem is that there are so many proteins within a cell with approximately the same size that it is almost impossible to separate them by size only. That is why one has to use another criterion to separate the proteins further. In this case 2D electrophoresis uses the different isoelectric points of the proteins which they reach at different ph‐values (O’Farrel 1975). In the procedure the first step is to linearize the proteins because in their natural tertiary structure they won’t fit through the pores of the gel. So all the intramolecular bonds which give the protein its form have to be broken. (E.g. H‐H bonds or sulfuric bonds) The next step is to separate the proteins by size as it is done with the DNA on a polyacrylamid gel which is applied with an electrical field. After the second step another gel with a ph gradient is put on the first and because of their charge the proteins begin to travel to their isoelectric point. Afterwards the gel with the previously luminescent marked proteins is visualized.
Figure 2: 2D Protein gel. Each dot represents one protein.
2.3 Cloning Vectors an DNA Libraries
Cloning Vectors are short DNA fragments (up to 19 kbp), as for example the ones we have retrieved with the restriction enzyme/gel electrophoresis technique. To analyze these DNA fragments and the genes on them we have to bring them into a living environment. Because DNA is the same in all living beings they can be inserted into bacteria which then express the proteins encoded on the DNA strands.
This is achieved by transformation where the DNA fragments, which are called cloning vectors, are added to a solution of bacteria cells. The cloning vectors can now penetrate the cells surface and get into the cell. There the original bacterial DNA plasmid is cut with the same restriction enzyme used to obtain the cloning vectors. Now there is a chance that the cloning vector is inserted into the plasmid by recombining the cut locations called sticky ends.
After the cloning vector is inserted the cells proliferate and are later separated by the newly resistances) new obtained
properties
antibiotic
through
DNA.
(e.g.
the
2.4 Hybridization and Blotting
Another basic problem is to identify whether a specific DNA sequences or protein is present in a given DNA/protein sample.
For DNA the technique at hand is the so called Southern Blotting (Southern 1975). A given DNA sample is first put through a gel electrophoresis to separate the DNA strands by size and is then washed on a nylon patch to fixate the strands. Afterwards the nylon patch is incubated at up to 80°C to break the hydrogen bonds so that the DNA gets single stranded. Now the nylon patch is washed again with a solution of hybridization probes, which are short fragments of the complementary DNA we want to test for. These probes are radioactively marked and will hybridize with the single stranded target DNA. Now the nylon patch is pressed against a X‐ray film where the hybridized probes will be visualized.
To test for the existence of specific proteins a similar technique is used which is named Western Blotting. Like Southern Blotting first the given protein sample is separated using 2D electrophoresis and then washed onto a carrier patch. In order to test for the targeted protein this technique uses marked antibodies as probes. Those marked probes can then again be visualized with an X‐ray film.
2.5 Centrifugation
One of the oldest techniques used for the separation of cell compartments is centrifugation. There the centrifugal force is used for the separation. More exactly the fact that molecules with different density will have different sedimentation rates. So that after a given time the compartments will be separated. Hereby the Sedimentation rate is measured in Svedenberg m units:
1(
r
r
)
/
=
S
V ²
w
r
=
par
sol f
Where m is the mass of the particle, f the friction of the medium and r sol/ r par the density of the medium/particle
2.6 Column Chromatography
In column chromatography the molecules one wants to separate are washed through a solid carrier material. Because of the different size and shape of the different molecules they arrive at different times at the bottom of the column. A more sophisticated method is also available where the carrier material is spiked with antibodies for a target protein. The antibodies will bind to target protein and hold it back while everything else is washed through. Then a solution is washed through which will loosen the protein form the antibodies and the protein can be retrieved.
3. Advanced Techniques
After having prepared the proteins or DNA we want to test we now need to have methods so that we can retrieve data from a large number of parallel experiments. To get confirmation or even more data to create statistics we need to do several of the same experiment at once. The techniques used for this purpose are called high throughput experiments because of the sheer amount of parallel processing and data we get.
3.1 PCR (Polymerase Chain Reaction)
PCR is not an experiment to retrieve data but more a method to amplificate DNA we already have prepared to an amount where it can be used in later high throughput techniques. (Saiki et al. 1985) Simply put PCR duplicates the amount of DNA per cycle. The first step is to heat the DNA solution so that the hydrogen bonds between the two DNA strands is broken an the DNA gets single stranded. Then primers are added to the solution which will hybridize with the single stranded DNA while the solution is cooling down. Now the DNA‐polymerase kicks in and extends the
single stranded DNA with primer to a new double stranded DNA strand. This leads to the duplication of DNA with each cycle so that after a few cycles there is sufficient DNA to use in a high throughput experiment.
Figure 3: PCR
3.2 DNA-/Protein Chips (Microarrays)
Microarrays are a newly developed method to test the expressions of thousands of genes at once (Cahill and Nordhoff 2003). There are two different types of microarrays, DNA‐chips and protein‐chips. While DNA chips test for the occurrence of mRNA in a cell, protein‐chips test for the occurrence of proteins. Both methods applied to the same cell will lead to different expression patterns because there are several factors influencing the translation from mRNA to proteins. Both methods work in a similar way.
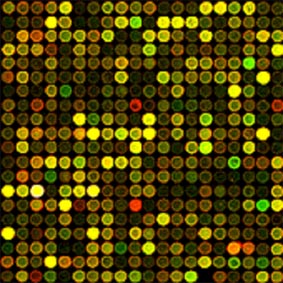
DNA chips are carrier spotted with cDNA primers from exons which one can get from a DNA library. Those chips are then incubated with DNA reversely transcribed from the target cells mRNA. This DNA is also marked with fluorescing dye so that the coloring of the chip reveals the expression of the correspondent genes. As you can see in fig.4 with the use of different dyes one can also do comparrison expereriments on one microarray.
Protein‐chips on the other hand are carriers spotted with binding partners for proteins which can be other proteins, antibodies, DNA or drugs. But protein‐chips are not that easy to apply because different proteins have different optimal conditions (e.g ph‐value) so that one has to find a sufficient compromise to acquire usable data.
3.3 Yeast Two-hybridization
Figure 4: Heatplot of a comparative microarray with two sources
The yeast‐two‐hybrid system is a technique used to test if two proteins, prey and bait, interact. (Uetz et al.2000) It uses the fact that the Gala4 Transcription factor consists of two parts. Those two parts are fused to either of the proteins one wants to test. If bait and prey do interact they come close together. When this happens the two parts of Gala4 TF also come close enough together so that it can the promote expression of a given reporter gene which is promoted by Gala4. For screening purposes this technique can be
Figure 5: Yeast-two-hybrid system
extended to a high throughput technique
by adding multiple prey proteins or even multiple bait proteins.
3.4 Mass Spectrometry
Mass spectrometry allows the identification of proteins through their mass/charge ratio (Abersold & Mann 2003). In a mass spectrometer basically the digested protein is ionized by an ion source and the fragments are accelerated through a magnet onto a mass analyzer. The detector then delivers a fingerprint of the containing fragments. This fingerprint is now compared to the precomputed theoretical fingerprints from a protein database.
There are different methods available for the ionization or the mass analysis. The two methods for ionization are ESI (Electrospray ionization) which is used to ionize proteins out of solutions and MALD (matrix assisted laser desorption/ionization) which is used on proteins in dry crystals.
Figure 6: Mass spectrometer
For the mass analysis there exist four basic types. The first is the sector field analyzer which is depicted in fig.6. It measures the deviation of a fragment from its trajectory according to the fact that heavier fragments won’t be deviated so much then lighter fragments. The second type of analyzer is the TOF (time of flight) analyzer which measures the time between entrance in the magnetic field and impact on the analyzer. This type also bases on the fact that heavier fragments won’t accelerate so fast then lighter ones because of their inertia. The third type is the quadrupole which allows only fragments to pass that have a specific mass/charge ratio. The quadrupole is used to measure the quantity of the targeted fragment. The last type is the Fourier transform ion cyclotron. Here the ions are accelerated in circular magnetic field. It measures the radius and the frequency of the flying fragments and computes from that the mass fingerprint. This is also by far the most accurate and sensitive type of analyzer.
3.5 Transgenic Animals
Transgenic animals are animals who’s DNA have been altered. Either by inserting foreign DNA or by willingly cutting out specific genes. Either of both happens with the firs stem cell before it begins to proliferate. There are two ways of getting the foreign DNA into the cell. The first is to directly inject it into the cell, which is called DNA microinjection. The second is to use an altered retrovirus which infects the cell.
Transgenic animals are mostly used as knockout animals where one specific gene is cut out to identify its function.
3.6 RNA Interference
RNA interference is mechanism inhibiting DNA expression where a double stranded RNA has been inserted into a cell (Fire et al. 1998). It is part of the cells defense system against viruses or other genomic material. The double stranded RNA is recognized by an endoribonuclease called DICER. DICER cuts the dsRNA into short strings (~20bps) which are then assembled to RISC (RNA‐induced silencing complex). The RISC complex then recognizes the correspondent mRNA and cuts it into short pieces which are then digested thus inhibiting the translation of this mRNA.
In opposition to transgenic animals this method is usable in high throughput experiments where many cells and/or genes can be inhibited at once. The only problem with RNA interference studies is that longer dsRNA strands lead to an interferon response in mammalian cells. This is why in these cases synthetically produced siRNA strands are used.(Dykxoorn et al. 2003)
- Discussion and Conclusion
As shown in the chapters above there are several techniques available to acquire high throughput data. The most upcoming are surely the microarray and the DNA interference techniques. What all techniques have in common is that they are very expensive to conduct either in the individual experiment like microarrays or in the needed infrastructure and machinery like a mass spectrometer. What they also have in common is that every one of them needs a lot of processing power to analyze the results. Not only to fit the data into models but simply to handle the sheer amount of data. This processing power is only available to everyone since the last few years. As research goes on and the field of system biology will surely grow it stands to hope that in mass production the techniques will be more affordable.
5. References
5.1 Literature
Cahill, D.J. and Nordhoff, E. Protein arrays and their role in proteomics (2003) Adv. Biochem. Eng. Biotechnol. 83, 177‐87.
Dykxoorn, D.M., Nivina, C.D. and Sharp, P.A. Killing the messenger: short RNAs that silence gene expression.(2003) Nat. Rec. Mol. Cell. Biol. 4, 457-67
E.Klipp, R.Herwig, A.Kowald, C.Wierling, H.Lehrbach System Biology in Practice. Concepts,Implementation and Application, (2005)Wiley-VCH 109- 133
Fire, A., Xu, S., Montgomery, M.K., Kostas, S.A., Driver, S.E., and Mello, C.C. Potent and specific genetic interference by double stranded RNA in Caenorhabditis elgeans (1998) Nature 391, 806‐ 11
O’Farrel. P.H. High resolution two-dimensional electrophpresis of proteins(1975) J. Biol. Chem 250, 4007-4021
Ruedi Aebersold & Matthias Mann Mass spectrometry-based proteomics (2003) Nature 422, 198-207
Saiki, R.K., Scharf, S., Faloona, F., Mullis,K.B., Horn, G.T., Erlich, H.A. and Arnheim, N. Enzamtic amplification of beta globin genomic sequences and restriction site analysis for diagnosis of sickle cell anemia.(1985) Science 230, 1350-1354
Southern, E.M. Detection of specific sequences among DNA fragments separated by gel electrophpresis (1975) J. Mol. Biol. 98, 503-517
Uetz, P., Giot, L., Cagney, G. Mansfield, T.A., Judson, R.S., Knight, J.R., Lockshon, D., Narayan, V., Srinivasan, M., Pochart, P., Qureshi‐Emili, A., Li, Y., Goodwin, B., Conover, D., Kalbfleisch, T., Vijayadamo‐Dar, G., Yang, M. Johnston, M., Fields, S., and Rothenberg J.M. A comprehensive analysis of protein-protein interaction in Saccharomyces cerivisiae (2000) Nature 403, 623‐7
5.2 Figures
Fig. 1: http://upload.wikimedia.org/wikipedia/commons/6/60/Gel_electrophoresis_2.jpg
Fig. 2: http://upload.wikimedia.org/wikipedia/de/b/b2/2D‐Gel.jpg
Fig. 3: http://www.obgynacademy.com/basicsciences/fetology/genetics/images/pcr.png
Fig. 4: http://www.bio.davidson.edu/COURSES/genomics/2005/Durnbaugh/microarray.jpg
Fig. 5: http://upload.wikimedia.org/wikipedia/en/e/e4/Three‐hybrid‐system.svg
Fig. 6: http://upload.wikimedia.org/wikipedia/commons/b/b8/Mass_spectrometer_schematics.png